Endocrine Research Center, Research Institute for Endocrine Sciences, Shahid Beheshti University of Medical Sciences, Tehran, Iran
Objective: To assess variations of urinary iodine concentration (UIC) during a 4-week period among pregnant and non-pregnant women in an iodine-replete area. Design: Pregnant (in their first trimester of pregnancy) and non-pregnant women referred to two maternity hospitals in Tehran were consecutively recruited from September 2005 to March 2006. Urine samples (5-10 mL) were collected on an every-other-day basis for 4 weeks (i.e., 12 samples for each individual). UIC was determined using a modified Sandell-Kolthoff method. Results: Thirty-six pregnant and 32 non-pregnant women completed the study. Mean±SD age of pregnant women was 27.4±6.4 and of non-pregnant women 27.6±4.5 years (P=0.897). Mean±SD gestational age was 11±3.3 weeks in pregnant participants. Median UIC of <100, 100-149, 150-249, and ≥250 µg/L was present in 19.4, 25, 30.6, and 25% of pregnant, 15.6, 37.5, 34.4, and 12.5% of non-pregnant, and 17.6, 30.9, 32.4, and 19.1% of total individuals, respectively. Median UIC values of samples numbers 1 to 12 were not significantly different either in pregnant (P=0.591) or in non-pregnant subjects (P=0.745). Except for sample number 11, median UIC was not significantly different between pregnant versus non-pregnant women (P values >0.05). Mean SD values for UIC in samples numbers 1 to 12 in pregnant women was 138.4 (24.1-404) and in non-pregnant women 118 (29.5-272.4) µg/L (P=0.286). Conclusion: There was a wide intrapersonal variation in UIC values among pregnant and non-pregnant women residing in an iodine-replete area, supporting the notion that casual UIC would not reflect the iodine status of the individual.
Daily variation, Iodine, Pregnancy, Trimester, Urine
INTRODUCTION
Global alertness to an adequate iodine intake among pregnant and lactating women and their offspring has heightened over the past few decades.1-5 Iodine is the major component of thyroid hormones and, therefore, plays an essential role in the metabolism of many organs, and especially the brain. Neurodevelopment of the fetus and breast-fed newborn and infant is crucially affected by maternal iodine intake.2,3 Elimination and sustainability of elimination of iodine deficiency disorders are both considered as major health and social goals in areas with a history of iodine deficiency, the latter because the reappearance of iodine deficiency is an ever-present risk in those regions.6 The Islamic Republic of Iran now meets all criteria for sustainable elimination of iodine deficiency.7 Measurement of median urinary iodine concentration (UIC) of casual urine samples has become one of the most common methods used in the field survey in order to assess iodine status in a region.8 Previous studies confirmed that if the spot urine samples are randomly collected from a sufficient number of individuals, median UIC obtained would be a reliable indicator of iodine status of that population and there would be no need for cumbersome and less feasible methods of measurement of iodine and/or creatinine in 24h urine.8-10
UIC values of casual urine samples show extensive variations during a day in adults and children and follow a circadian rhythm.11 This intrapersonal variability remains in the consecutive days within a month.12 It is as yet debatable whether a casual urine sample would reflect overall adequacy of iodine intake in a given subject. In other words, the question still remains as to whether a subject with a low iodine level in the casual urine specimen could be considered an individual with iodine deficiency. While some investigators maintain that a person with a UIC below a certain threshold (e.g., 50 µg per liter) is considered as iodine deficient,10 others believe that individuals with low UIC in a casual urine sample in a given day may well have adequate or even excessive iodine excretion during the following days12 and, therefore, the median UIC (and not the iodine level of a single spot urine sample) would better reflect the true iodine consumption status of individuals in a given region.
Iodine deficiency has been aggressively addressed in Iran by the legislation of salt iodization since 1994 and two national surveys have shown consumption of iodized salt by more than 95% of the population and an adequate UIC of 232 and 190 among schoolchildren in 1996 and 2001, respectively.13,14 National salt iodization has resulted in a non-fluctuating supply of iodine to pregnant women and there were no significant differences in median UIC values among them in all four seasons.15 Hence, we hypothesized that in our region with such a continuous and adequate supply of iodine via household salt usage, the daily variability of UIC would not be observed.
The aim of this study was to assess variability of urinary iodine excretion among pregnant women during their first trimester of pregnancy and compare it to a control group of non-pregnant women. We are unaware of any previous study that assessed daily variation of UIC values in pregnant women residing in an iodine-replete area.
MATERIALS AND METHODS
Pregnant women referred to the mother and child health care clinics of two maternity hospitals of Tehran were consecutively recruited for the study from September 2005 to March 2006. To reach a desirable sample size, and anticipating a 30% dropout rate, we recruited 40 individuals in each group at the beginning of the study. Trained midwives obtained written consent after appraisal of the pregnant women about the rationale of the study. Obstetrical history was taken using a standard questionnaire and physical examination was performed. Gestational age was calculated from the first day of the last normal menstrual period and gestational ages <15 weeks comprised the first trimester of pregnancy. Only pregnant women during their first trimester of pregnancy were recruited.
In order to produce a control group, females who were referred to the mother and child health care clinics for the routine obstetrical examination and had negative pregnancy test throughout the study were enrolled. Women with a past history of thyroid ablation and consumption of thyroid affecting medications were excluded from the study. All pregnant women had been residents of Tehran for a long time.
Casual morning urine samples (5-10 mL) of each group, both pregnant and non-pregnant, were collected in screw-top containers. In order to increase compliance of the participants for completion of the study, it was decided to collect only three casual urine samples on an every-other-day (instead of every day) basis during a week and for 4 consecutive weeks. In this way urine samples nos. 1–3, 4–6, 7–9, 10–12 belonged to the first, second, third, and fourth week of collection. The study was approved by the appropriate Human Research Committee of Shahid Beheshti University of Medical Sciences.
Laboratory methods
The urine samples were kept by the participants in the containers and separately in plastic bags in a cool place (e.g., refrigerator) and every three samples collected each week were delivered to the mother and child health care clinics where they were immediately transported to the Endocrine Research Center. The samples were kept frozen at -20°C until assayed at the end of the study. Iodine content of the urine samples was measured by a modified Sandell-Kolthoff digestion method.15 UIC values were stratified into values <150, 150-249, 250-499, and ≥500 µg/L representing insufficient, adequate, more than adequate, and excessive UIC values.16
All urine samples were assayed in random order and in one run, and the intra-assay coefficients of variation of the method for 10 replicates were 11.3% for 3.5 µg/L, 8.4% for 14 µg/L, and 9.7% for 36 µg/L. For method validation, the assay sensitivity, intra- and inter-assay, recovery and parallelism tests were checked. The assay sensitivity based on zero standard mean signal (replication No.10) ±2SD was determined at 0.5µg/L. The intra-assay (n = 8) in three ranges (coefficient variation) 3.5, 12.7, 36.2 µg/L were 8.6, 6.7, and 9.3 %, respectively, and inter-assay CV% for the mentioned consequence were 9.1, 8.6, and 12.3%, respectively.
Statistical analysis
It was calculated that at least 30 women in each (pregnant and non-pregnant) group should be recruited to obtain α = 5%, β = 90%, standard deviation (SD) = 50 µg/L, minimal UIC variation of 35 µg/L between two samples. The number was calculated according to the formula: N= (Z1-α + Z 1-ß) 2r (SD)2/d2 = (1.96 + 0.82)2 r2(50)2/(35)2 that would be equal to 30 cases in each group. Distribution of UIC values was tested for normality using the Kolmogorov-Smirnov test. Pair-wise comparisons for UIC values between cases and controls were performed using the Mann-Whitney test. UIC values of samples nos. 1 to 12 in each group were compared by the Friedman test. Correlation between UIC values among 12 samples in a given individual in pregnant and non-pregnant women was performed using Spearman’s correlation test. The non-parametric runs test was used to assess whether intrapersonal occurrence of UIC ≥150 µg/L among 12 samples was random.18 The intraclass correlation coefficient (ICC) was done between urinary iodine concentrations in each group.19-21 Coefficient of variation of UIC values in pregnant and non-pregnant women was calculated using standard deviation divided by mean UIC values times 100. P values less than 0.05 were considered as significant. Data were analyzed using the SPSS software package (version 9.05, SPSS, Inc., Chicago, IL).
RESULTS
In each group 40 women were recruited at the beginning of the study. Missing data was related to 4 women in the pregnant and 8 in the non-pregnant group; 36 pregnant and 32 non-pregnant women eventually completed the study. The characteristics of the study participants are summarized in Table 1. There were no significant variations in age and parity among pregnant versus non-pregnant women.
Median UIC of 12 samples was measured for each subject; distribution of median UIC values in pregnant, non-pregnant, and total subjects are shown in Table 2. Nearly half of all individuals had median UIC values less than 150 in their 12 casual urine samples.
Median (range) UIC values of the urine samples by the week of sample collection are shown in Table 3. In general, median UIC values were greater in pregnant than in non-pregnant women but they did not reach a statistical significance in all samples (except for sample number 11 that showed significant difference). Using the Friedman test, median UIC did not show a significant intrapersonal variation either in pregnant or non-pregnant individuals.
There were high intrapersonal variations in UIC values (Figures 1 and 2). UIC values lower than 100 or higher than 250 µg/L were observed in the same person during the first to the last week of urine sampling. Mean coefficient of variation of UIC values in pregnant women was 60 ± 25% and in non-pregnant women it was 60 ± 22% (P = 0.99). Mean (range) values of SD of UIC values in samples nos. 1 to 12 in pregnant women was 138.4 (24.1-404) µg/L and in non-pregnant women it was 118.0 (29.5-272.4) µg/L (P = 0.286). Also, the runs test revealed that among pregnant women there were 4 subjects whose UIC values were totally higher (n=2) or lower (n=2) than the cut-off of UIC ≥150 µg/L. For these individuals the test could not be performed. Among the 32 remainders, 28 of the subjects had non-significant P values, indicating that in 87.5% of cases the occurrence of UIC ?≥150 µg/L was random. Among non-pregnant women there was only one whose UIC values were lower than the cut-off and the runs test was not performed for her. The runs test was non-significant in 27 (87.1%) of the 31 remaining non-pregnant women. The results of the runs test demonstrate high variability of UIC values among our study population.
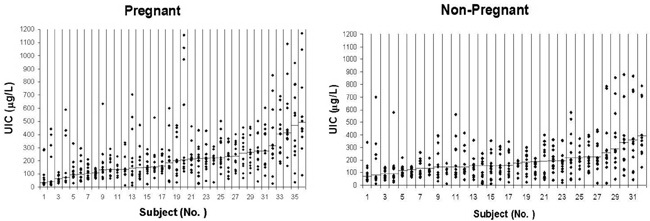
Figure 1. Dispersion of UIC values in pregnant (panel A) and non-pregnant (panel B) women. There was an excessive intrapersonal variation of UIC values either in pregnant or in non-pregnant participants. The small horizontal bars in each column show median UIC of 12 individuals’ samples. Samples are sorted / graded from the lowest to the highest median values.
Α. Pregnant Women 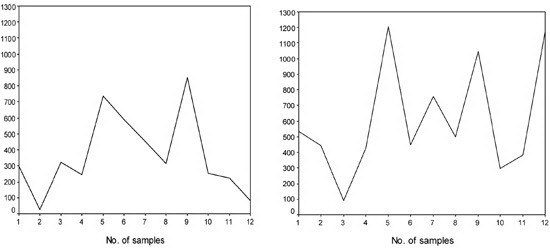
B. Non-Pregnant Women 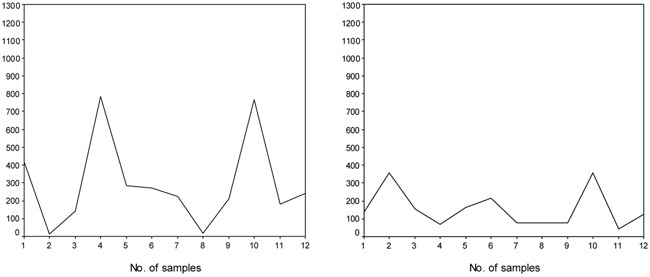
Figure 2A, B. Some of the individuals (panel A and B) who showed frank variations in their UIC values during the first to the last week of urine sampling. Number of samples shows the time order of consecutive sampling in each individual from the first to the twelfth sample. Please note that many of the pregnant or non-pregnant women showed UIC values either lower than 100 or higher than 250 μg/L on a course of consecutive sampling within 4 weeks.
Intrapersonal correlation of UIC values showed that only 27.3% of correlations were statistically significant (P <0.05). However, when correlation of UIC values in a given sample was assessed with its one previous and one later samples, 9 (81.8%) of 11 situations in pregnant women were statistically significant (P values <0.05) with r values ranging between 0.34-0.54. Four (44.4%) of 9 significant correlations (i.e., 36.4% of total situations) had moderate strength (r values between 0.52-0.54) and the remainder had low strength. Similarly, 6 (54.5%) of 11 situations in non-pregnant women were statistically significant (P values <0.05) with r values ranging between 0.39-0.62. Four (66.7%) of 6 significant correlations (i.e., 36.4% of total situations) had moderate strength (r values between 0.52-0.62) and the remainder had low strength. It should be noted that correlation of sample no. 1 could only be assessed with sample no. 2 and that of sample no. 12 could only be assessed with sample no. 11 in each group of participants. Intraclass correlation coefficient (ICC, CI) for urinary iodine concentrations is depicted in Table 4.
DISCUSSION
In the present study conducted in an area with iodine sufficiency, it was shown that, despite a legislated national program of iodization of all household salts and the consumption of iodized salt by more than 95% of the population, which sustained adequate median UIC among schoolchildren in all provinces of Iran 2 and 7 years after national salt iodization,13,14 excessive intrapersonal variations in UIC values (and thus in iodine intake) persisted among pregnant and non-pregnant women.
The best method of urine sampling by which iodine determination would reflect the iodine status of individuals continues to be a matter of debate. While determination of iodine in casual urine samples is routine in most field surveys,8 some investigators prefer iodine measurement in 24h urine specimens with concomitant measurement of creatinine, considering it as a better indicator of iodine status in that given population. However, even for 24h urine sampling, more than one sample should be used to determine the iodine status of an individual.22 On the other hand, apart from the technical difficulties involved in collection of 24h urine samples, there is evidence that iodine to creatinine ratio in urine may be an inferior index in comparison to the simple UIC measurement.23 However, pregnant women as well as lactating women and their newborns up to early infancy are among the most vulnerable populations for the detrimental effect of iodine deficiency.2 During recent decades much attention has been paid to these target populations and their iodine statuses, but there still remain many areas to be studied and assessed.24
A cross-sectional study was conducted in four cities of Iran in 1996-1998. The study showed an adequate median UIC value of 186 µg/L among Tehranian pregnant women, for whom, however, trimester specification was not determined.25 We have shown in a prospective study conducted in Tehran in 2004-2006 that our national salt iodization with 40 parts per million potassium iodide has resulted in a continuous iodine supply among pregnant women and that there were no seasonal fluctuations in median UIC values in all trimesters of pregnancy.26
In the present study, similarly to our previous report,26 median UIC was borderline sufficient in the first trimester of pregnancy. Moreover, non-pregnant women showed median UIC <150 in 41.6% on occasion (Table 3). In general, median UIC values were higher in pregnant than in non-pregnant women (although this difference was not statistically significant). This seems to be due to increased glomerular filtration rate occurring in early pregnancy.27
In some countries, although the main dietary iodine supply is via iodized salt, other sources like seafood, seaweed, iodine-enriched (cow’s) milk, and bread are additionally available and have considerable impact on the general iodine intake of the population.28,29 In Switzerland with borderline iodine sufficiency based on median UIC of 115 in schoolchildren30 and unstable dietary iodine intake with decreasing UIC values from early to late pregnancy,31 adults showed highly variable urinary iodine excretion within three consecutive weeks of a month.12
In Iran, however, the main source of iodine supply is iodized salt for household use and there are no other sources of iodine intake like iodized milk and/or bread at the population level. This exclusive and adequate iodine supply at the population level convinced us to conduct a study to assess whether similar extensive UIC variations would be observed in our population. Recently, the iodine nutrition status has been evaluated in a cross-sectional study conducted in Tehran, in which the median daily salt intake was 7.9 g and median iodine content of household salt was 21.2 ppm.32
Taking into consideration the abovementioned issues and the lack of certainty that a casual urine iodine value would reflect iodine status of an individual, we assessed the UIC values of 36 pregnant women on 12 urine samples collected every other day for a period of 4 weeks. UIC values in urine samples collected in a similar way were assessed among non-pregnant women who were matched with pregnant women for age and the region where they reside.
There were significant intrapersonal correlations of a given UIC value with its one previous and one later UIC values, but the strength of these correlations was low to moderate. Hence, it is conceivable that UIC value in a given sample would be mildly to moderately similar to those samples obtained 2 days before and after that given sample (a period of 5 days). However, general low intrapersonal correlation (i.e., 27.3%) in UIC values during the whole 4-week period revealed that UIC of a given sample cannot reflect monthly UIC value (or iodine intake) of that individual. This was further supported by randomness of occurrence of UIC ≥150 µg/L in approximately 87% of both pregnant and non-pregnant participants.
In conclusion, the results of the present study revealed that even in our country with adequate iodine intake (based on adequate median UIC in schoolchildren) and no seasonal fluctuation of UIC values during pregnancy, pregnant and non-pregnant women showed highly variable iodine excretion, this demonstrating the fact that one cannot estimate iodine status of an individual via a casual urine sample iodine level. This finding is in agreement with the previous notion that iodine level of a spot urine sample would not reflect iodine status of the individual. As the universal salt iodization may not be adequate during pregnancy, we need to prepare pregnant women with multivitamin containing iodine.
ACKNOWLEDGEMENT
The authors wish to thank the participants for making the study possible. We also wish to thank Ms. Golnaz Tajadod for urinary iodine determination. This study was supported by a grant from the Endocrine Research Center, Shahid Beheshti University of Medical Sciences, Tehran, Iran.
CONFLICT OF INTEREST
None declared.
REFERENCES
1. Hetzel BS, 1983 Iodine deficiency disorders (IDD) and their eradication. Lancet 2: 1126-1129.2. Delange FM, Dunn JT, 2005 Iodine deficiency. In: Braverman LE, Utiger RD (eds) Werner and Ingbar’s The Thyroid: A fundamental and clinical text, 9th ed, Lippincott Williams and Wilkins, Philadelphia; pp, 264-288.
3. Chan S, Kilby MD, 2000 Thyroid hormone and central nervous system development. J Endocrinol 165: 1-8.
4. Delange F, 2005 Epidemiology and impact of iodine deficiency in pediatrics. J Pediatr Endocrinol Metab 18: 1245-1251.
5. Vitti P, Delange F, Pinchera A, Zimmermann M, Dunn JT, 2003 Europe is iodine deficient. Lancet 361: 1226.
6. Guttikonda K, Burgess JR, Hynes K, Boyages S, Byth K, Parameswaran V, 2002 Recurrent iodine deficiency in Tasmania, Australia: a salutary lesson in sustainable iodine prophylaxis and its monitoring. J Clin Endocrinol Metab 87: 2809-2815.
7. Delshad H, Amouzegar A, Mirmiran P, Mehran L, Azizi F, 2012 Eighteen years of continuously sustained elimination of iodine deficiency in the Islamic Republic of Iran: the vitality of periodic monitoring. Thyroid 22: 415-421.
8. WHO, UNICEF, ICCIDD (eds) 2001 Assessment of the iodine deficiency disorders and monitoring their elimination: A guide for programme managers, 2nd ed, WHO/NHD/01.1, Geneva; pp, 1-107.
9. Vought RL, London WT, Lutwak L, Dublin TD, 1963 Reliability of estimates of serum inorganic iodine and daily fecal and urinary iodine excretion from single casual specimens. J Clin Endocrinol Metab 23: 1218-1228.
10. Bourdoux P, 1998 Evaluation of the iodine intake: problems of the iodine/creatinine ratio--comparison with iodine excretion and daily fluctuations of iodine concentration. Exp Clin Endocrinol Diabetes 106 Suppl 3: 17-20.
11. Als C, Helbling A, Peter K, Haldimann M, Zimmerli B, Gerber H, 2000 Urinary iodine concentration follows a circadian rhythm: a study with 3023 spot urine samples in adults and children. J Clin Endocrinol Metab 85: 1367-1369.
12. Burgi H, Bangerter B, Siebenhuhner L, 2000 High day-to-day variability of urinary iodine excretion despite almost universal salt iodization in Switzerland. In: Geertman RM (ed) World Salt Symposium, Vol. 2, Elsevier, Amsterdam; pp, 961-963.
13. Azizi F, Sheikholeslam R, Hedayati M, et al, 2002, Sustainable control of iodine deficiency in Iran: beneficial results of the implementation of the mandatory law on salt iodization. J Endocrinol Invest 25: 409-413.
14. Azizi F, Mehran L, Sheikholeslam R, et al, 2008 Sustainability of a well-monitored salt iodization program in Iran: marked reduction in goiter prevalence and eventual normalization of urinary iodine concentrations without alteration in iodine content of salt. J Endocrinol Invest 31: 422-431.
15. Dunn JT, Crutchfield HE, Gutekunst R, Dunn AD, 1993 Methods for measuring iodine in urine. The Netherlands: ICCIDD/UNICEF/WHO Publications.
16. WHO technical consultation on iodine deficiency in pregnant and lactating women and children under 2 years, 2005 WHO, Geneva, 24-26 January.
17. Munro BH, 2001 Correlation. In: Munro BH (ed) Statistical methods for health care research, 4th ed, Lippincott, Philadelphia; pp, 223-243.
18. Sprent P, Smeeton NC, 2001 Other single-sample inferences. In: Sprent P, Smeeton NC (eds) Applied nonparametric statistical methods, 3rd ed, Chapman & Hall / CRC, Boca Raton; pp, 78-119.
19. Teitelbaum SL, Britton JA, Calafat AM, et al, 2008 Temporal variability in urinary concentrations of phthalate metabolites, phytoestrogens and phenols among minority children in the United States. Environ Res: 1062: 257-269.
20. Hauser R, Meeker JD, Park S, Silva MJ, Calafat AM, 2004 Temporal variability of urinary phthalate metabolite levels in men of reproductive age. Environ Health Perspect 112: 1734-1740.
21. Rosner B 2006 Fundamentals of Biostatistics.In: (Sixth Edition). Duxbury Press, Pacific. Grove, CA.
22. Rasmussen LB, Ovesen L, Christiansen E, 1999 Day-to-day and within-day variation in urinary iodine excretion. Eur J Clin Nutr 53: 401-407.
23. Furnée CA, van der Haar F, West CE, Hautvast JG, 1994 A critical appraisal of goiter assessment and the ratio of urinary iodine to creatinine for evaluating iodine status. Am J Clin Nutr 59: 1415-1417.
24. Semba RD, Delange F, 2001 Iodine in human milk: perspectives for infant health. Nutr Rev 59: 269-278.
25. Azizi F, Aminorroya A, Hedayati M, Rezvanian H, Amini M, Mirmiran P, 2003 Urinary iodine excretion in pregnant women residing in areas with adequate iodine intake. Public Health Nutr 6: 95-98.
26. Ainy E, Ordookhani A, Hedayati M, Azizi F, 2007 Assessment of intertrimester and seasonal variations of urinary iodine concentration during pregnancy in an iodine-replete area. Clin Endocrinol 67: 577-581.
27. Davison JM, 1987 Kidney function in pregnant women. Am J Kidney Dis 9: 248-252.
28. Pearce EN, Pino S, He X, Bazrafshan HR, Lee SL, Braverman LE, 2004 Sources of dietary iodine: bread, cows’ milk, and infant formula in the Boston area. J Clin Endocrinol Metab 89: 3421-3424.
29. Als C, Haldimann M, Burgi E, Donati F, Gerber H, Zimmerli B, 2003 Swiss pilot study of individual seasonal fluctuations of urinary iodine concentration over two years: is age-dependency linked to the major source of dietary iodine? Eur J Clin Nutr 57: 636-646.
30. Hess SY, Zimmermann MB, Torresani T, Burgi H, Hurrell RF, 2001 Monitoring the adequacy of salt iodization in Switzerland: a national study of school children and pregnant women. Eur J Clin Nutr 55: 162-166.
31. Brander L, Als C, Buess H, et al, 2003 Urinary iodine concentration during pregnancy in an area of unstable dietary iodine intake in Switzerland. J Endocrinol Invest 26: 389-396.
32. Nazeri P, Mirmiran P, Mehrabi Y, Hedayati M, Delshad H, Azizi F, 2010 Evaluation of iodine nutritional status in Tehran, Iran: iodine deficiency within iodine sufficiency. Thyroid 20: 1399-1406.
Address for correspondence:
Fereidoun Azizi, Professor of Endocrinology and Internal
Medicine, Endocrine Research Center, Tehran, Iran,
P.O. Box: 19395-4763; Tel.: +98-21-22409309; Fax: +98-21-22402463;
E-mail: azizi@endocrine.ac.
Received 03-08-12, Accepted 29-12-12