1Laboratory of Clinical Chemistry-Biochemistry, University Hospital, 2Laboratory of Experimental Endocrinology-Clinical Immunology, University Hospital, 3Laboratory of Experimental Endocrinology-Clinical Immunology, University of Crete, School of Medicine, 4Laboratory of Clinical Chemistry, University of Crete, School of Medicine, Heraklion, Crete, Greece
OBJECTIVE: The determination of the normal range of 25-hydroxyvitamin D [25-(OH)D], though currently based on suppression of PTH levels, still remains a controversial issue. The 25-(OH)D levels exhibit gender and seasonal variability, the latter attributed in part to changes of insolation. DESIGN: The aim of this cross-sectional study was to estimate the levels of 25-(OH)D on the island of Crete and their correlation with metabolic, hormonal and bone turnover parameters. The study was performed over a period of five years and involved 8,183 male and female individuals (8,042 analyzed). RESULTS: Our results are as follows: (1) 25-(OH)D was significantly lower than expected (19.48±9.51 and 18.01±9.01 (ng/mL+SD) in males and females, respectively); (2) seasonal variation of 25-(OH)D was observed in both sexes (females < males), with values peaking in August; (3) a decline of 25-(OH)D was evident with advancing age, with lower levels in females compared to males up to menopause and no apparent difference between the genders thereafter; (4) levels of 25-(OH)D were lower in renal function impairment, diabetes/insulin resistance and inflammation, while no correlation was detectable in thyroid dysfunction; (5) normalization of PTH levels was observed at ~20 ng/mL 25-(OH)D. At the same cut-off level, a significant decrease of all measured bone turnover indices (b-ALP, osteocalcin and CTX) was evident. CONCLUSION: Based on the above data, it appears that a cut-off level of 25-(OH)D close to 20 ng/mL better reflects the physiology of our population.
Bone metabolic biomarkers, Cut-off values, Vitamin D deficiency, PTH, 25-(OH)vitamin D
INTRODUCTION
The steroid hormone/vitamin D (VitD) exists in two forms, D2 (ergocalciferol) and D3 (cholecalciferol). The former is obtained from food (plant-derived, mainly mushrooms), while the latter is naturally synthesized in the skin, through exposure to ultraviolet light, and also ingested in the diet (animal-derived, mainly fatty fish, eggs, liver).1,2 Both forms are used for food fortification (dairy products, cereals and juice) and in VitD supplements. In humans, the endogenous production by the skin following exposure to sunlight UV radiation represents the main source of VitD.1
The principal biological effect of VitD is on growth and remodeling of the skeleton by enhancing intestinal calcium absorption.3 Recently though, the discovery of the almost ubiquitous distribution of VDR and cytochrome P450 27B1 in the human body4 suggests that local conversion of 25-hydroxyvitamin D [25-(OH)D] to its hormonally active 1,25-dihydroxy form [1,25-(OH)2D] may have multiple biological roles in almost all tissues, beyond the skeleton. More specifically, VitD appears to have a pivotal role in the regulation of cell growth, proliferation, differentiation and apoptosis, as well as various immunological functions and is thus implicated in several pathophysiological conditions, including cancer, diabetes, cardiovascular disease, multiple sclerosis, other autoimmune diseases and neuropsychiatric disorders.4-8
VitD deficiency or insufficiency may be due to reduced intake/bioavailability (obesity or malabsorption), decreased direct sunlight exposure or hepatic and/or renal disease.9,10 The subsequent decline in intestinal calcium and phosphorus absorption may lead to increased PTH levels, resulting in secondary hyperparathyroidism and consequently depletion of the bones of calcium in order to maintain normocalcemia.1 Therefore, in addition to the levels of circulating calcium and phosphate, PTH and biomarkers of bone turnover are useful indicators of VitD status, although their levels do not linearly follow 25-(OH)D fluctuations.
The generally accepted normal cut-off levels for 25-(OH)D have been set at >30 ng/mL to ensure optimal effects on calcium economy and skeletal health.11 This rationale is based on maximal intestinal calcium absorption and nadir concentrations of parathyroid hormone (PTH), reported to be achievable at 25-(OH)D levels of approximately 30-40 ng/mL,12-15 and is underscored by the updated recommendations of the US Endocrine Society.1 However, both tenets have recently been challenged:16-19 The boundary for clinically relevant VitD deficiency, characterized by osteopenia and rickets/ osteomalacia, has traditionally been set at 10 ng/mL 25-(OH)D,17,20 a point recently disputed by the US Endocrine Society, that has raised the VitD deficiency threshold to 20 ng/mL 25-(OH)D.1 25-(OH)D “insufficiency” spans the range between the frank deficiency threshold and the lower normal level (traditionally 10-30 ng/mL), indicating inadequate stores for optimal VitD functions, but generally not associated with overt clinical symptoms.21
VitD overall status in vivo is best estimated by the concentration of serum total 25-(OH)D, i.e. the sum of 25-(OH)D2+25-(OH)D3.1 Fully automated platforms have been developed and concerns stemming from the lack of agreement regarding the methods used to measure VitD are being abated by advances in methodology and availability of accurate calibration materials and quality assessment programs.8,15
Abundant evidence exists that VitD deficiency and insufficiency have emerged as a global health threat across all ethnicities and age groups, with approximately 1 billion people estimated to be affected worldwide, the Mediterranean region being no exception in spite of the high insolation (total amount of solar radiation energy received per surface area) of the area.11,22 The aim of this cross-sectional study was to determine the total serum 25-(OH)D levels on the island of Crete, Greece, an area with high insolation. In addition, we sought to explore 25-(OH)D association with biomarkers of diabetes, metabolic syndrome, inflammation and bone remodeling, as well as the influence of season change and gender. Finally, we attempted to establish a 25-(OH)D threshold for our population and to compare it with the internationally proposed cut-offs for VitD sufficiency.
MATERIALS AND METHODS
Population
The Department of Clinical Chemistry-Biochemistry at the University Hospital of Heraklion is the regional reference center for VitD assays. We therefore retrieved 25-(OH)D measurements blindly from the Laboratory Information System (LIS) of the Hospital, without any patient identification. Our cohort included 8,183 total 25-(OH)D results, measured in our Department during a 5-year time period, between August 2009 and May 2014. Of the 8,183 subjects, 2,789 were hospital inpatients and 5,394 outpatients. The inpatients were hospitalized in diverse departments: endocrinology (n=1398), paediatrics (n=337), rheumatology (n=201), internal medicine (n=169), nephrology (n=126), orthopaedics (n=109), paediatric oncology (n=91), haematology (n=81), oncology (n=70), neurology (n=57), surgery (n=48), gastroenterology (n=30), pulmonary medicine (n=25), cardiology (n=22), psychiatry (n=10), obstetrics/gynecology (n=10, excluding pregnant women), dermatology (n=5). The outpatients were prescribed routine testing for VitD status. For the purpose of our study, we stratified this population according to age, sex (Table 1) and season of the year when the analysis was performed. Age was not available for 141 subjects (43 males and 98 females, 85 outpatients and 56 inpatients) and their results were discarded from all further analyses.
Laboratory assays
Details of all laboratory methods together with their reference intervals and the number of patients for whom results were available are presented in Table 2. These include routine biochemical workout tests (glucose, urea, creatinine, albumin, calcium, phosphate, triglycerides, total cholesterol, HDL cholesterol, LDL cholesterol), glycated hemoglobin A1c (HbA1c), C-reactive protein (CRP), hormonal determinations (intact PTH, TSH, insulin), bone turnover biomarkers (bone-specific isoform of alkaline phosphatase (b-ALP as activity and ostase as mass), N-Mid osteocalcin (OC), C-terminal telopeptide of type I collagen (CTX), urine free deoxypyridinoline crosslinks [Dpd]), tumor markers (CEA, CA 19-9, CA 125) and virology indices (HBsAg, HIV1/2, HCV). However, as tumor markers and virology indices were available in a very small sub-group of our data, we waived their further analysis. The laboratories performing the above mentioned assays participated in External Quality Assurance Services programs for the entire duration of the study and the observed deviation in Levey-Jennings charts was lower than +1SD for all analytes measured.
Biochemical monitoring of the rate of bone turnover is assessed by measurement of specific biomarkers in the blood and/or urine, either proteins or enzymes released during bone formation, or degradation products released during bone resorption.23 The bone-specific isoform of alkaline phosphatase is a biomarker of bone formation not affected by diet and renal function and exhibiting low inter-individual variability. Its main disadvantage is that changes can lag by several weeks, thus making it unsuitable for initial follow-up of antiresorptive therapy. Osteocalcin (OC), produced by osteoblasts and incorporated into the bone matrix during bone formation and also released into the circulation from the matrix during bone resorption, is considered a marker of bone turnover. Its main advantages are tissue-specificity and relatively low within-individual variation, while its principal disadvantage concerns the instability of the intact molecule, which is rapidly degraded. The large N-terminal/midregion fragment (N-Mid, aa 1-43) appears to be considerably more stable.24 The C-terminal crosslinked telopeptide of type I collagen (CTX) is the bone resorption marker of choice, recommended by the International Osteoporosis Foundation (IOF) and the International Federation of Clinical Chemistry and Laboratory Medicine (IFCC).25 β-CTX levels are indicative of the degree of the breakdown of mature type I collagen and are the preferred marker for monitoring the start of antiresorptive therapy. The main disadvantage stems from its large circadian variation, necessitating a morning fasting sample for accurate interpretation of results. The urine free deoxypyridinoline crosslinks (Dpd), released when mature type I collagen is degraded, are tissue-specific and not influenced by the diet. The main disadvantage is the necessity of a 24-hour urine sample and the need to correct results for creatinine excretion.
As a general procedure, a blood sample was collected from each subject; the blood was allowed to clot and serum was separated by centrifugation, with the exception of HbA1c which was determined in whole blood. Testing was performed on the day of blood collection for routine biochemistry, HbA1c, CRP and hormonal measurements. Serum and 24-hour urine samples for 25-(OH)D and bone turnover biomarkers measurements were frozen at -20oC after collection and tested later, as assays for these parameters are performed on a weekly basis. All assays were performed according to the manufacturers’ instructions.
Validation of the serum total 25-(OH)D assay used in our study
Prior to analysis, we confirmed that our assay actually measured the total amount of 25-(OH)D. For this purpose, we collected and pooled samples in which measured values were >30 ng/mL. One volume of saturated trichloroacetic acid (TCA) was added to four volumes of sample and the resulting mixture was vortexed and centrifuged. The addition of TCA causes protein precipitation and release of any bound (micro)molecules, including 25-(OH)D. The resulting supernatant was buffered with the 25-(OH)D assay buffer (200 μL supernatant plus 500 μL of buffer) in order to restore pH, necessary for the correct performance of the immunoassay and assayed again for 25-(OH)D. Taking all dilutions into account, the recovery was 109±8%, suggesting that in our assay the majority of protein-bound 25-(OH)D was released from proteins and hence our data should represent total 25-(OH)D.
Statistical analysis
The analysis was performed with the SPSS V21 program. All data were normalized by z-transformation ((parameter value-mean)/SD) prior to any statistical test. However, for the readers’ convenience, non-transformed values are reported in the Tables and Figures. For the comparison of the two groups, we used a t-test with unequal variance; for the comparison of multiple groups, we used one or two ways ANOVA, as appropriate, with Bonferroni-correction for post-hoc analyses. Multivariate analysis was used for group comparisons, the confounders being detailed in the Results section. Subjects were stratified by decade of age or by classification into four age groups (0-20, 21-50, 51-70, >70 y), for some analyses, as detailed in the Results section. Menopausal age for female individuals was arbitrarily set at 50 years. 25(OH)VitD values were stratified into the following groups: <10, 10-15, 15-20, 20-25, 25-30, >30 ng/mL. Correlations were analyzed by extracting the Pearson coefficient. For logistic regression, all variables were coded as low (0), normal (1) or high (2), the cut-offs being presented in Table 2. Stepwise backward parameter elimination was performed, with p<0.05 for entry and p>0.1 for the removal of parameters. In all tests a p<0.05 was considered as significant.
RESULTS
Distribution of total 25-(OH)D values
Effect of age and gender
Of the 8,042 individuals included in the study, 1,663 were males (20.7%) and 6,379 females (79.3%). In both groups, mean 25-(OH)D levels were unexpectedly low for a population living in a Mediterranean region. Mean 25-(OH)D concentration was 19.48±9.51 (ng/mL+SD) in males and 18.01±9.01 (ng/mL+SD) in females. A comparison of inpatients and outpatients yielded similar results; therefore we combined these two groups and performed the analysis on the total population of our study. Age distribution of mean total 25-(OH)D values (Figure 1A) showed that the highest values were present in children and adolescents of both genders (mean values for males=24.2±9.75, females=23.15±10.67 ng/mL; mean±SD), while a progressive and significant (p<0.001) decrease with age was evident. The mean concentration of serum 25-(OH)D in the elderly (>70 years) was significantly lower compared to the other age groups (mean±SD values for males=15.29±48.50, females=15.77±8.67 ng/mL, p<0.001 in both cases) and the lowest observed in our subjects. An inverse linear trend was apparent with advancing age, being more evident in subjects over 70 years.
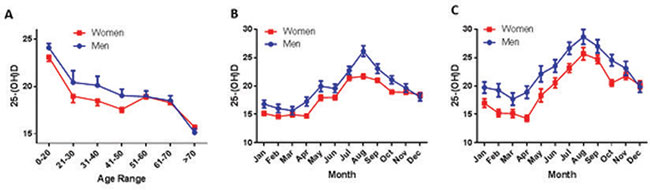
Figure 1. 25-(OH)D significantly varies with age, season and gender. A. Mean ± SE variation of 25-(OH)D concentration in male (blue curve) and female individuals (red curve), as a function of age. Subjects have been divided by decades of age, except for individuals between 0 and 20 and over 70 years. Values were significantly different (p<0.001) among different age-groups. Females always had lower values than males (p<0.001), until menopause, arbitrarily set at 50 years of age. According to these results, we have further constructed four different age-groups (see Table 1), representing children and adolescents (age 0-20), adults (age 20-50), middle-aged (age 50-70) and elderly (>70 years). B. and C. Monthly fluctuation of mean±SE values of 20-(OH)D variations in the whole population (B) and in individuals ≤ 50 years (premenopausal females and corresponding males) (C). Month values were significantly different (p<0.001), with females always lower than corresponding males.
An interesting observation was that despite the high percentage of sunny days on the island of Crete, 21% of our population was severely VitD deficient according to the standard criteria of our method, exhibiting levels below 10 ng/mL 25-(OH)D. Additionally, a significant (p=0.02) difference between sexes was evident in that the levels of 25-(OH)D were significantly lower in females compared to males, up to the age of 50 years. Thereafter, 25-(OH)D levels did not differ between genders (Figure 1A).
Seasonal variation
25-(OH)D levels depend on sun exposure, which fluctuates with the seasons.2,10,26-28 In our cohort also, a significant seasonal variation of 25-(OH)D was evident (p<0.001) (Figure 1B, Table 3). Interestingly, there was one major peak throughout the year, with values significantly increasing from April to August and linearly decreasing thereafter, roughly corresponding to maximum insolation and UV index on the island of Crete (source http://www.bing.com/search?q=weather). This profile remained unchanged throughout the five years of the study. It is of note that 25-(OH)D levels in December were still significantly higher compared to those in January-March (p=0.002). Restricting the analysis to subjects aged <50 years, in which the gender difference was significant, resulted in two parallel month-distribution curves, this suggesting a similar variation of 25-(OH)D concentration between sexes and confirming the major effect of sunshine on endogenous VitD production (Figure 1C).
Correlation of total 25-(OH)D levels with PTH and bone turnover biomarkers
As a second step, we explored possible univariate correlations between 25-(OH)D and parameters of bone metabolism and turnover (Ca, P, PTH, b-ALP, Ostase, N-Mid-Osteocalcin and D-Pyrilinks; Figure 2A). We confirmed the well-established10,29,30 strong positive correlation between circulating 25-(OH)D levels and Ca and P, together with a significant inverse correlation with PTH16,31 (ANOVA p<0.001, for all three) (Figure 2B, Table 3). In addition, we observed a weak but significant correlation between 25-(OH)D and osteocalcin and CTX (p=0.03 and 0.003, respectively) (Table 3).
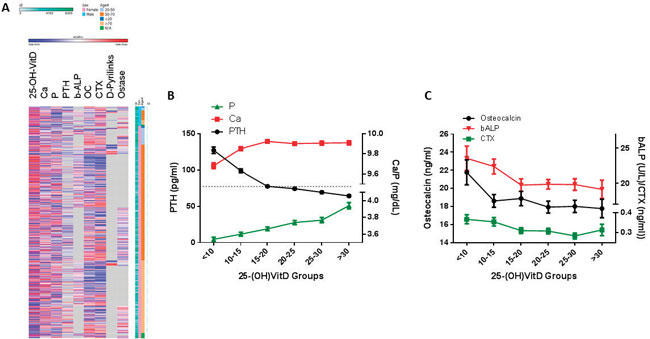
Figure 2. 25-(OH)D correlates with bone-metabolic indices. A. Heatmap of normalized (z-transformed) values of bone metabolism-related parameters. In the vertical axes, individuals were sorted by gender and age groups. B. Variation (mean±SE) of intact PTH (black line), calcium and phosphate (red and green line respectively), as a function of 25-(OH)D groups, as detailed in the ordinate. Dotted line shows the upper normal cut-off value for PTH. All three parameters vary significantly among groups (p<0.001). As detailed in Table 1 and the Results section, PTH decreases significantly up to a 25-(OH)D concentration of 20 ng/mL, and non-significantly thereafter. At the same threshold, calcium serum concentrations reach a plateau. C. Bone metabolic indices, as a function of 25-(OH)D concentration (mean±SE). Osteocalcin, bone-specific alkaline phosphatase activity (b-ALP) and C-terminal telopeptide of type I collagen (CTX), bone turnover, formation and resorption markers (black, red and green lines) are significantly (p<0.001) decreased as 25-(OH)D increases, in multivariate analysis with age and gender as confounders. As presented, at 25-(OH)D levels ~20 ng/mL, the maximum significant decrease is observed, for all parameters. It is noteworthy, however, that all three indices vary within their normal range, at all 25-(OH)D concentrations.
Since significant differences in circulating 25-(OH)D levels were observed between sexes and age-groups, we used these two factors as confounders in multivariate analysis, with 25-(OH)D groups as the grouping variable. Ca, P and PTH varied significantly compared to with 25-(OH)D levels (p<0.001 for all three parameters, Figure 2B). PTH levels decreased sharply (p<0.001) until 25-(OH)D levels reached ~20 ng/mL, at which threshold normalization was attained (dotted line) and further decreased in a slow, not statistically significant, manner thereafter. From ~20 ng/mL 25-(OH)D, a plateau in Ca levels was also observed, while P gradually increased with increasing 25-(OH)D levels. A mean 25-(OH)D concentration of 19.854 ng/mL (confidence interval 19.292-20.416 ng/mL, corrected for gender and age differences) was sufficient to normalize PTH levels (p<0.001), with Ca levels of 9.86 mg/dL (CI 8.01-8.91) and P concentrations of 3.70 mg/dL (CI 3.66-3.75).
Levels of 25-(OH)D were inversely correlated with b-ALP, ostase, CTX and osteocalcin (p<0.001 for all analytes) in a multivariate model with age and gender as confounders. No significant changes for D-pyrilinks were found, most probably due to the extremely small number of available results (n=94). Nevertheless, it should be stressed that all bone turnover biomarkers varied within their normal reference interval (Figure 2C).
Correlation of total 25-(OH)D with metabolic parameters
25-(OH)D serum concentrations were correlated with a number of metabolic parameters, after correcting for gender, age and seasonal variations (Figure 3, Table 4).
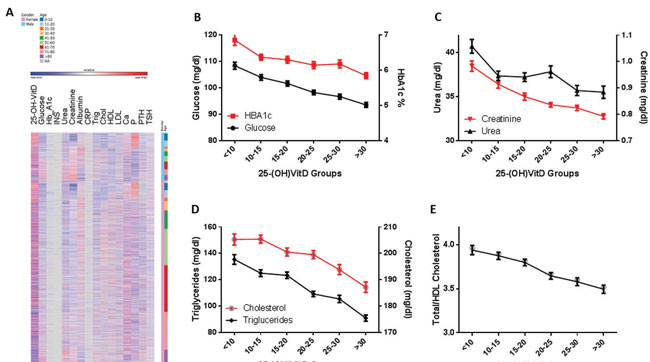
Figure 3. Metabolic parameters vary significantly with 25-(OH)D concentration. A. Heatmap of normalized (z-transformed) values of metabolic parameters. In the vertical axes, individuals were sorted by gender and age groups. Glucose and HbA1c (B), urea and creatinine (C), cholesterol and triglycerides (D) are presented (mean±SE) as a function of 25-(OH)D groups (concentration ranges are presented in the ordinate). All changes are significant in a multivariate analysis (p<0.001), with age and gender as confounders. E. Total/HDL cholesterol ratio (cut-off level <5 32) also varies significantly (p<0.001) with circulating 25-(OH)D, in a multivariate analysis, with the same confounders.
A significant negative correlation between 25-(OH)D and glucose, as well as HbA1c, was observed (p<0.001 for both). The absence of any correlation with insulin was probably due to the extremely small number of available insulin data (n=115).
A significant negative correlation between 25-(OH)D and biochemical markers of renal function was evidenced (urea and creatinine, p<0.001).
A significant negative correlation was noted between 25-(OH)D and both circulating triglycerides and total cholesterol (p<0.001 for both), but no associations were apparent with either HDL or LDL cholesterol. However, a significant negative correlation between 25-(OH)D and the total/HDL cholesterol ratio (cut-off value 5,32 p<0.001) was observed.
No correlation between 25-(OH)VitD and TSH was found.
Finally, a strong positive correlation (p<0.001) was evident between 25-(OH)D and albumin.
Taken together, these data suggest that 25-(OH)D is decreased: (i) in patients with impaired renal function (reflected by elevated urea and creatinine levels), (ii) in patients with a biochemical profile indicative of metabolic syndrome (increased glucose, triglycerides and total cholesterol levels), (iii) in patients with overt diabetes (reflected by increased HbA1c).
Lastly, we performed a logistic regression of 25-(OH)D with a number of serum metabolic analytes. The cut-off level for 25-(OH)D was set at 20 ng/mL, based on our results on PTH and bone turnover indices. Only the significant analytes retained by the model, after backward elimination, are represented in Figure 4A. We conclude that a significant probability for decreased total 25-(OH)D, as expressed by odds ratios, is expected in overt diabetic fasting glucose levels (>126 mg/dL), and elevated cholesterol and creatinine levels, compatible with metabolic disease and impaired renal function. It is of interest to note that borderline glucose levels (>100 mg/dL) were not associated with a probability of decreased 25-(OH)D concentration (OR 0.983, CI 0.793-1.218). Finally, a decreased albumin concentration (indicative of liver damage or inflammation) also predicted low levels of 25-(OH)D (see below and Figure 4B).
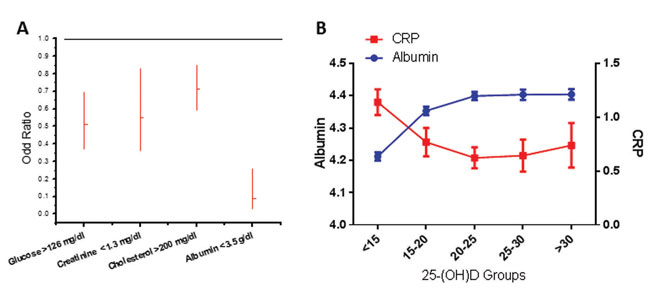
Figure 4. A. Results of binary logistic regression between 25-(OH)D high/low levels (cut-off set at 20 ng/mL) and all biological parameters included in our study. For all parameters low/normal/high coding was used, based on cut-off values presented in Table 2. Backward stepwise elimination of parameters (p to exclude= 0.10) was performed, and only significant parameters are shown (as Odd Ratios and 95% confidence intervals). B. Correlation of 25-(OH)D levels and indices of inflammation. Figure depicts the variation of albumin (blue curve) and CRP (red curve) as a function of 25-(OH)D groups, presented in the ordinate (mean±SE).
Total 25-(OH)D and inflammation
The levels of albumin correlated positively with 25-(OH)D. In order to decipher whether this was the result of inflammation (albumin reduction is an acute phase marker of inflammation), we examined the relationship between 25-(OH)D and albumin against the prototype biomarker of inflammation, C-reactive protein (CRP) (Figure 4B, Table 4). In our dataset, a CRP value was available in 1,148 subjects. A significant correlation of 25-(OH)D with albumin and CRP was evident (p<0.001 for both). These data were also found in our logistic regression analysis, with odds ratios 0.090 (95% CI 0.031-0.260) and 0.697 (95% CI 0.451-1.076) for CRP, indicating a probability of decreased 25-(OH)D when albumin levels were <3.5 g/dL and CRP levels were >0.8 mg/dL, confirming the association of decreased 25-(OH)D with inflammation. Notably, in a univariate analysis (with gender, age and season as confounders), a significant (p<0.05) correlation of 25-(OH)D with normal CRP variation (cut-off <0.8) was also evidenced.
DISCUSSION
In the present study, we performed a cross-sectional analysis of 8,042 single measurements of serum total 25-(OH)D over a 5-year period on the island of Crete. We investigated the effects of seasonal fluctuation, age and gender on circulating levels of 25-(OH)D and attempted to establish correlations with a number of biochemical indices of inflammation, metabolic syndrome and diabetes, as well as with PTH and several biomarkers of bone turnover. Furthermore, as no dietary products are fortified with calcium and VitD in Greece (with the exception of infants’ and children’s milk) and 66% of our subjects were outpatients, our data represent a valid estimate of the general population of a large Mediterranean island adhering, in principle, to the traditional Mediterranean diet.
The globally reported seasonal fluctuation of 25-(OH)D levels,28,33-41 attributed to cutaneous synthesis of VitD being affected by geographical location and season,2,26,27,42 was also observed in our cohort. Consequently, given this universally observed seasonal variation of VitD levels, caution should be exercised when single “snapshot” measurements of 25-(OH)D form the basis for recommendations on VitD supplementation and associations with various health outcomes.43 Furthermore, in agreement with other large population-based studies,44-46 our data revealed a linear decline of circulating 25-(OH)D levels with advancing age. The highest values, observed in children and adolescents of both genders, probably reflect VitD and calcium-fortified milk consumption in the 0-20 years age category. The progressive decrease thereafter may be explained by either avoidance of exposure to direct sunlight (or use of sunscreens) with advancing age because of skin cancer concerns, or drastic decrease of mobility due to orthopedic or other health problems and the well-documented reduction of the ability of the ageing skin to synthesize VitD precursors,11,27 coupled with dietary habits that seldom include VitD-rich foods and the absence of fortified products in Greece. One should also be aware of the age-related PTH increase, together with the physiological loss of bone mass with age, which might confound correlations between VitD status and bone remodeling laboratory indices.47-49 The reverse phenomenon has been reported in Finland where advancing age has been associated with higher 25-(OH)D values in both sexes up to the age of 80 and was attributed to an “active pensioner” outdoor lifestyle, increased consumption of fatty fish, as well as dairy product fortification and VitD supplement use.20,50
Consistent with previous studies,20,38,40,51-54 25-(OH)D levels in females were found to be lower compared to males, up to the age of 50 years; thereafter the levels of 25-(OH)D were not different from those of males. A plausible explanation might include VitD and calcium supplementation in post-menopausal women together with changes in circulating estrogen levels, as well as lifestyle factors not addressed in this study (e.g. differences in sun exposure, diet and BMI between sexes).52,55 Indeed, 25-(OH)D has been significantly and positively associated with total testosterone and SHBG levels before and after adjustment for age and ethnicity,56 although VitD supplementation per se does not appear to influence testosterone levels.57 In addition, short-term administration of testosterone does not appear to alter 25-(OH)D levels.58
The most intriguing finding of our study was the suboptimal 25-(OH)D values observed in both genders (males=19.48±9.51 and females=18.01±9.01, ng/mL±SD), contrary to what would be expected in an area with abundant sunshine and a population prone to outdoor activities. This is in line with other studies indicating that 25-(OH)D levels in Mediterranean countries,12,55,59-64 and in Greece specifically,28,64 are often surprisingly low, with reported levels as low as 9.4 ng/mL in males and 8.5 ng/mL in females in autumn.65 Our results are also in agreement with published reports suggesting that insolation in a certain region may not be the sole, or even an accurate, predictor of the VitD status.28,59,66,67 Along the same lines, an unexpected inverse north-south gradient for VitD levels in Europe is often reported,41,59 with 25-(OH)D levels positively correlated with latitude, and is primarily attributed to dietary habits (higher consumption of VitD-rich foods in the north), supplementation (Greece presented the lowest mean supplement intake, 2% in men and 6.7% in women),68 and differences in the population’s skin pigmentation.55 The opposite has also been observed in the “SUpplémentation en VItamines et Minéraux AntioXydants” study (SUVIMAX, 1994) in 35-65 year-old French adults, with reported mean serum levels of 17.2 ng/mL in the north versus 37.6 ng/mL in the south.12 The above discrepancies could be attributed to differences in methodologies employed, populations tested, season of sample collection and, certainly, nutritional, anthropometric, sociodemographic and genetic factors, known to influence VitD status.52,55
The well-documented inverse relationship between PTH and 25-(OH)D16,31 was also evident in our dataset and the intersection point, where PTH levels normalized, was at approximately 20 ng/mL of 25-(OH)D in both sexes. Of course, low levels of VitD cause secondary hyperparathyroidism, which preserves normocalcemia at the expense of bone health;69 on the other hand, the 25-(OH)D concentration below which high levels of PTH ensue is not well established and a widely discrepant range (10-49 ng/mL) has been reported.52,70 It is worthy of note that other studies, one of them from Greece,28 using a VitD loading test and the locally weighed regression scatterplot smoothing (LOWESS) method between PTH and 25-(OH)D, concluded that the lower normal levels for 25-(OH)D in their population were 2228 and 20 ng/mL,71 comparable with those reported in the present study. The interrelationship between PTH and VitD levels is always interwoven with calcium intake and absorption, parameters that are difficult to measure in everyday clinical practice.29,52 Therefore, while the major biological effect of PTH in our cohort was manifested at 25-(OH)D levels below 20 ng/mL, we recognize that potentially harmful non-skeletal effects at 25-(OH)D concentrations between 20-30 ng/mL cannot be excluded, albeit below the sensitivity of bone metabolic indices, which always varied within their normal range.
We further observed weak significant negative correlations with two biochemical indices of bone metabolism, osteocalcin (bone turnover) and CTX (bone resorption), by applying the 25-(OH)D level corresponding to PTH normalization in our cohort (20 ng/mL) as a cut-off. These correlations were maintained in multivariate analysis, with age and sex as confounders. Our results are in agreement with those reported in the Longitudinal Aging Study Amsterdam (LASA), that serum osteocalcin and urinary deoxypyridinoline, another resorption marker, decreased with increasing serum 25-(OH)D up to 16 ng/mL. Other groups have also observed that markers of bone resorption show the biggest rise when 25-(OH)D levels fall below 20 ng/mL41,72-74 and acceleration of bone turnover due to secondary hyperparathyroidism has been reported at 25-(OH)D levels of less than 6 ng/mL.17 The documented inverse relationship between bone-specific alkaline phosphatase and 25-(OH)D levels33,41,73,75 was also evident in our cohort, although variations were strictly within the normal reference range. It is noteworthy that significant changes in biomarkers of bone turnover are not always evident, despite an observed increase in 25-(OH)D levels and concomitant decrease in PTH levels when administering supplementation with oral VitD.76,77
As has been reported by others,78,79 a negative correlation between 25-(OH)D levels and glucose, triglycerides and total cholesterol was apparent in our population, confirming that higher serum concentrations of 25-(OH)D tend to be associated with a more favorable lipid profile. Literature reports on the association between VitD and total cholesterol are often discrepant, even when extensive adjustments for confounding factors (particularly BMI) have been applied,45,80,81 while the association between VitD and triglycerides is consistently reported as negative,82 with two exceptions concerning adolescent girls.83,84 Interestingly, no significant correlation between 25-(OH)D levels and HDL cholesterol was observed in our cohort, consistent with existing literature.79,85 However, this element is debated in the majority of cross-sectional studies,82,86 while interventional studies demonstrated minor effects of VitD supplementation on lipid variables,82,87 particularly on serum HDL.88 It is of interest that the total/HDL cholesterol atherosclerotic ratio (normally <5)32 was negatively correlated with 25-(OH)D concentrations, further confirming the protective effects of VitD on vascular health.82,89,90
Another finding, which further corroborated the inverse correlation of 25-(OH)D with metabolic disease/diabetes in our analysis, was the negative association between 25-(OH)D levels and HbA1c values. This inverse association is supported by other published reports20,91-93 and the seasonal variation of 25-(OH)D levels is inversely mirrored by HbA1c, with the lowest levels observed in the summer.94 Indeed, low levels of 25-(OH)D are considered a risk factor for the development of insulin resistance and diabetes,4,95 although the preventive effect of VitD supplementation has not yet been fully established.96-98 One should bear in mind that although low levels of 25-(OH)D have been linked to the metabolic syndrome, obesity, diabetes, myocardial infarction and other cardiovascular diseases and despite the fact that overall cardiovascular death and manifestations of cardiovascular events are more frequent in the winter, when 25-(OH)D levels are at their lowest, associations have not been proven to be causal.78,94,99-103
No correlation was evident between TSH levels and 25-(OH)D groups in our population, in spite of reported associations between 25-(OH)D and thyroid function.104
Decreased levels of 25-(OH)D are a common finding in patients with impaired kidney function,105,106 which was also obvious in our dataset. Chronic kidney disease (CKD) is characterized by secondary hyperparathyroidism, which progresses with gradual deterioration of renal function and is partially attributed to the derangement of VitD metabolism.107 VitD has an expanded role in renal physiology, through both classical and non-classical actions, and appears to affect disease progression and mortality in CKD patients.108,109
The inverse association between VitD status and inflammation has been described in published reports110,111 and was also evident in our population, through correlations of 25-(OH)D with albumin and CRP levels, even within the normal reference range for CRP. The immunomodulatory and anti-inflammatory properties of VitD are among its earliest and best described non-classical actions.112-117 Indeed, the acute-phase response has been linked to an early and sharp decrease in circulating 25-(OH)D levels, which correlates with inverse changes in CRP and persists even after resolution of the inflammatory reaction.110,118,119 Practically all studies evaluating the association between 25-(OH)D levels and acute-phase response have reported a concomitant decrease in serum albumin.110,111 This observed decline in serum 25-(OH)D concentration has been attributed to several mechanisms, including decreased levels of carrier proteins, increased conversion of 25-(OH)D to its active 1,25 form and acute fluid shift.111 Inflammation-related hypovitaminosis D is difficult to interpret since the causality/consequence is unclear and both the biological implications and clinical relevance of this correlation are presently not known. A recent hypothesis proposes that low VitD levels (coupled with increased 1,25-(OH)2D concentrations) are a consequence rather than the cause of chronic inflammation, provoked by occult intracellular infection.120,121 Finally, the association of decreased 25-(OH)D levels with the various components of the metabolic syndrome and, as a result, low-grade metabolic inflammation could be yet another confounder,20,122 further supporting the proposed anti-inflammatory actions of VitD.123
Several variables are known to affect VitD status in a given population, including sun exposure, use of sunscreens, nutritional habits, anthropometric indices and lifestyle features, such as outdoor activity, smoking and alcohol consumption. There are no cultural restrictions, as in the Arab world for females, on sun exposure or excessive clothing in Crete, and moderate sun exposure through daily-life activities appears to adequately improve VitD status.67 Food sources rich in VitD are not routinely consumed in Greece, fortified products are absent (with the exception of infants’ and children’s milk) and vitamin supplementation is uncommon. On the other hand, adequate calcium intake protects from the development of hyperparathyroidism when VitD status is suboptimal and in this situation low 25-(OH)D levels are associated with lower than expected PTH levels.16,124 We can assume that calcium intake is adequate in our population due to high availability and consumption of dairy products.125,126 Regarding adiposity indices, a negative association between levels of 25-(OH)D and overweight/obesity is well established44,67,127-131 and more pronounced with percentage of body fat rather than body mass index (BMI). Underweight, though not as extensively explored, may also be negatively related to VitD status.51,67 In overweight/obese subjects, the upper PTH value has also been reported to be higher than in lean individuals124 and obesity may also possibly blunt 25-(OH)D seasonal variation.132 Physical activity per se, and not as a surrogate marker for sun exposure, may also be linked to higher VitD status.67,133 Smoking is inversely related to 25-(OH)D levels in most studies,134,135 although no association has also been reported.136,137 Smoking is also associated with lower PTH levels,138 blunted 1,25-(OH)2D-PTH axis and impairment of calcium absorption.139 Excessive alcohol consumption is linked to lower 25-(OH)D concentrations,140 but moderate intake is consistently reported to relate to better VitD status.30,67,131,141,142
Strengths of our study include the large number of subjects for whom 25-(OH)D measurements were available and the wide age distribution, which lead us to consider our cohort as being representative of the general population of a Mediterranean island. The inherent limitations of our work lie in its retrospective design and the mixed population studied (in- and outpatients), although no significant differences between the two groups were found. In addition, since inpatients represented various hospital departments, our data are not skewed by the results of a certain in-hospital unit and do not promote any given pathology. All data were extracted from the Hospital LIS system and as a consequence we cannot provide information on additional parameters influencing 25-(OH)D circulating levels, as detailed above, or on the medical history of our subjects. The demographic group of our study was primarily composed of women (79%), which could account for lower VitD status.20,38,40,51-53 However, 25-(OH)D levels were below 20 ng/mL for both sexes and no sex-related differences in PTH concentrations were observed.
It is worth mentioning that even when most of the determinants known to influence VitD status are taken into account, the individual variability of 25-(OH)D levels is difficult to explain.137 The genetic component is emerging as a strong predictor, as polymorphisms within various genes involved in the metabolic pathway of VitD (VitD-binding protein, megalin, cubilin, CYP27B1, CYP24A1, VDR) may explain not only a substantial percentage of the interindividual variability of 25-(OH)D, but also its association with major clinical outcomes5,18,67,143,144
Several recently published reports challenge the established “normal” cut-off point for 25-(OH)D sufficiency.19,21 According to the NHANES 2005-2006 findings, the mean 25-(OH)D concentration is approximately 24 ng/mL in most age groups. Furthermore, the US Institute of Medicine (IOM) in 2011 concluded that serum 25-(OH)D levels >20 ng/mL are sufficient for almost the entire (97.5%) population, at least as regards Caucasians.15
In conclusion, our data lead us to adopt the Institute of Medicine’s 2011 guidelines regarding the normal reference range for serum total 25-(OH)D and to propose setting the normal low level for 25-(OH)D to indicate sufficiency at 20 ng/mL, at least for the population of Crete. In addition, our study also raises questions as to the use of “snapshot” single-measurements of 25-(OH)D levels when attempting to demonstrate health risks associated with VitD deficiency and their outcomes, consistent with the recommendation of Anthony Norman that “normal 25-(OH)D serum levels” are those that support all VDR-containing target organs in all the world’s population groups.145
ACKNOWLEDGEMENTS
The authors are indebted to the four anonymous reviewers who, with their excellent comments, have helped us improve the quality of our work. This work was partially supported by the European Union Programs Regional Potential/Translational Potential Grant 285948.
REFERENCES
1. Holick MF, Binkley NC, Bischoff-Ferrari HA, et al, 2011 Evaluation, treatment, and prevention of vitamin D deficiency: an Endocrine Society clinical practice guideline. J Clin Endocrinol Metab 96: 1911-1930.
2. W.H.O., International Agency for Research on Cancer. 2008 Vitamin D and Cancer. WHO Press: Volume 5
3. Holick MF, 2006 Resurrection of vitamin D deficiency and rickets. J Clin Invest 116: 2062-2072.
4. Song Y, Wang L, Pittas AG, et al, 2013 Blood 25-hydroxy vitamin D levels and incident type 2 diabetes: a meta-analysis of prospective studies. Diabetes Care 36: 1422-1428.
5. Agmon-Levin N, Theodor E, Segal RM, Shoenfeld Y 2013 Vitamin D in systemic and organ-specific autoimmune diseases. Clin Rev Allergy Immunol 45: 256-266.
6. Bikle D 2009 Nonclassic actions of vitamin D. J Clin Endocrinol Metab 94: 26-34.
7. Gardner DG, Chen S, Glenn DJ 2013 Vitamin D and the heart. Am J Physiol Regul Integr Comp Physiol 305: R969-977.
8. Su Z, Narla SN, Zhu Y 2014 25-Hydroxyvitamin D: analysis and clinical application. Clin Chim Acta 433: 200-205.
9. Sathe MN, Patel AS 2010 Update in pediatrics: focus on fat-soluble vitamins. Nutr Clin Pract 25: 340-346.
10. Holick MF, 2007 Vitamin D deficiency. N Engl J Med 357: 266-281.
11. Holick MF, Chen TC, 2008 Vitamin D deficiency: a worldwide problem with health consequences. Am J Clin Nutr 87: 1080-1086.
12. Chapuy MC, Preziosi P, Maamer M, et al, 1997 Prevalence of Vitamin D Insufficiency in an Adult Normal Population. Osteoporosis Int 7: 439-443.
13. Heaney R, Dowell MS, Hale CA, Bendich A, 2003 Calcium absorption varies within the reference range for serum 25-hydroxyvitamin D. J Am Coll Nutr 22: 142-146.
14. Heaney RP 2004 Functional indices of vitamin D status and ramifications of vitamin D deficiency. Am J Clin Nutr 80: Suppl: 1706-1709.
15. Ross AC, Manson JE, Abrams SA, et al, 2011 The 2011 report on dietary reference intakes for calcium and vitamin D from the Institute of Medicine: what clinicians need to know. J Clin Endocrinol Metab 96: 53-58.
16. Steingrimsdottir L, Gunnarsson O, Indridason OS, Franzson L, Sigurdsson G, 2005 Relationship between serum parathyroid hormone levels, vitamin D sufficiency, and calcium intake. JAMA 294: 2336-2341.
17. Need AG, O’Loughlin PD, Morris HA, Coates PS, Horowitz M, Nordin BE, 2008 Vitamin D metabolites and calcium absorption in severe vitamin D deficiency. J Bone Miner Res 23: 1859-1863.
18. Thacher TD, Clarke BL, 2011 Vitamin D insufficiency. Mayo Clin Proc 86: 50-60.
19. Lee AM, Sawyer RK, Moore AJ, Morris HA, O’Loughlin PD, Anderson PH, 2014 Adequate dietary vitamin D and calcium are both required to reduce bone turnover and increased bone mineral volume. J Steroid Biochem Mol Biol 144PA: 159-162.
20. Miettinen ME, Kinnunen L, Leiviska J, et al, 2014 Association of Serum 25-Hydroxyvitamin D with Lifestyle Factors and Metabolic and Cardiovascular Disease Markers: Population-Based Cross-Sectional Study (FIN-D2D). PLoS One 9: e100235.
21. Rosen CJ, 2011 Clinical practice. Vitamin D insufficiency. N Engl J Med 364: 248-254.
22. Palacios C, Gonzalez L, 2014 Is vitamin D deficiency a major global public health problem? J Steroid Biochem Mol Biol 144PA: 138-145.
23. Wheater G, Elshahaly M, Tuck SP, Datta HK, van Laar JM, 2013 The clinical utility of bone marker measurements in osteoporosis. J Transl Med 11: 201.
24. Delmas PD, Eastell R, Garnero P, Seibel MJ, Stepan J 2000 The Use of Biochemical Markers of Bone Turnover in Osteoporosis. Osteoporosis Int 6: Suppl: 2-17.
25. Vasikaran S, Eastell R, Bruyere O, et al, 2011 Markers of bone turnover for the prediction of fracture risk and monitoring of osteoporosis treatment: a need for international reference standards. Osteoporosis Int 22: 391-420.
26. van Schoor NM, Knol DL, Deeg DJ, Peters FP, Heijboer AC, Lips P, 2014 Longitudinal changes and seasonal variations in serum 25-hydroxyvitamin D levels in different age groups: results of the Longitudinal Aging Study Amsterdam. Osteoporosis Int 25: 1483-1491.
27. Lips P, van Schoor NM, de Jongh RT, 2014 Diet, sun, and lifestyle as determinants of vitamin D status. Ann N Y Acad Sci 1317: 92-98.
28. Singhellakis PN, Malandrinou F, Psarrou CJ, Danelli AM, Tsalavoutas SD, Constandellou ES, 2011 Vitamin D deficiency in white, apparently healthy, free-living adults in a temperate region. Hormones (Athens) 10: 131-143.
29. Atapattu N, Shaw N, Hogler W, 2013 Relationship between serum 25-hydroxyvitamin D and parathyroid hormone in the search for a biochemical definition of vitamin D deficiency in children. Pediatr Res 74: 552-556.
30. Shirazi L, Almquist M, Malm J, Wirfält E, Manjer J, 2013 Determinants of serum levels of vitamin D: a study of life-style, menopausal status, dietary intake, serum calcium, and PTH. BMC Women’s Health 13: 33-40.
31. Heaney RP, 2005 The Vitamin D requirement in health and disease. J Steroid Biochem Mol Biol 97: 13-19.
32. Millán J, Pintó X, Muñoz A, et al, 2009 Lipoprotein ratios: Physiological significance and clinical usefulness in cardiovascular prevention. Vasc Health Risk Manag 5: 757-65
33. Thomas MK, Lloyd-Jones DM, Thadhani RI, et al, 1998 Hypovitaminosis D in medical inpatients. N Engl J Med 338: 777-783.
34. Fradinger EE, Zanchetta JR, 1999 Vitamin D status in women living in Buenos Aires. Medicina (B Aires) 59: 449-452.
35. Goswami R, Gupta N, Goswami D, Marwaha RK, Tandon N, Kochupillai N, 2000 Prevalence and significance of low 25-hydroxyvitamin D concentrations in healthy subjects in Delhi. Am J Clin Nutr 72: 472-475.
36. El-Hajj FG, Nabulsi M, Choucair M, et al, 2001 Hypovitaminosis D in healthy schoolchildren. Pediatrics 107: E53.
37. Pasco JA, Henry MJ, Nicholson GC, Sanders KM, Kotowicz MA, 2001 Vitamin D status of women in the Geelong Osteoporosis Study: association with diet and casual exposure to sunlight. Med J Aust 175: 401-105.
38. Lips P, Hosking D, Lippuner K, et al, 2006 The prevalence of vitamin D inadequacy amongst women with osteoporosis: an international epidemiological investigation. J Intern Med 260: 245-254.
39. van der Meer IM, Boeke AJ, Lips P, et al, 2008 Fatty fish and supplements are the greatest modifiable contributors to the serum 25-hydroxyvitamin D concentration in a multiethnic population. Clin Endocrinol (Oxf) 68: 466-472.
40. Mithal A, Wahl DA, Bonjour JP, et al, 2009 Global vitamin D status and determinants of hypovitaminosis D. Osteoporosis Int 20: 1807-1820.
41. Lips P, Duong T, Oleksik A, et al, 2001 A Global Study of Vitamin D Status and Parathyroid Function in Postmenopausal Women with Osteoporosis- Baseline Data from the Multiple Outcomes of Raloxifene Evaluation Clinical Trial. J Clin Endocrinol Metab 86: 1212-1221.
42. Chen TC, Chimeh F, Lu Z, et al, 2007 Factors that influence the cutaneous synthesis and dietary sources of vitamin D. Arch Biochem Biophys 460: 213-217.
43. Rosecrans R, Dohnal JC, 2014 Seasonal vitamin D changes and the impact on health risk assessment. Clin Biochem 47: 670-672.
44. Jorde R, Sneve M, Emaus N, Figenschau Y, Grimnes G, 2010 Cross-sectional and longitudinal relation between serum 25-hydroxyvitamin D and body mass index: the Tromso study. Eur J Nutr 49: 401-407.
45. Melamed ML, Michos ED, Post W, Astor B, 2008 25-hydroxyvitamin D levels and the risk of mortality in the general population. Arch Intern Med 168: 1629-1637.
46. Zittermann A, Ernst JB, Gummert JF, Borgermann J, 2014 Vitamin D supplementation, body weight and human serum 25-hydroxyvitamin D response: a systematic review. Eur J Nutr 53: 367-374.
47. Korpi-Steiner N, Milhorn D, Hammett-Stabler C, 2014 Osteoporosis in men. Clin Biochem 47: 950-959.
48. Schousboe JT, Bauer DC, 2012 Clinical use of bone turnover markers to monitor pharmacologic fracture prevention therapy. Curr Osteoporos Rep 10: 56-63.
49. Rejnmark L, Vestergaard P, Heickendorff L, Mosekilde L, 2011 Determinants of plasma PTH and their implication for defining a reference interval. Clin Endocrinol (Oxf) 74: 37-43.
50. Jaaskelainen T, Knekt P, Marniemi J, et al, 2013 Vitamin D status is associated with sociodemographic factors, lifestyle and metabolic health. Eur J Nutr 52: 513-25.
51. Hintzpeter B, Mensink GB, Thierfelder W, Muller MJ, Scheidt-Nave C, 2008 Vitamin D status and health correlates among German adults. European journal of clinical nutrition 62: 1079-1089.
52. Touvier M, Deschasaux M, Montourcy M, et al, 2014 Interpretation of plasma PTH concentrations according to 25OHD status, gender, age, weight status, and calcium intake: importance of the reference values. J Clin Endocrinol Metab 99: 1196-1203.
53. Looker AC, Pfeiffer CM, Lacher DA, Schleicher RL, Picciano MF, Yetley EA, 2008 Serum 25-hydroxyvitamin D status of the US population: 1988-1994 compared with 2000-2004. Am J Clin Nutr 88: 1519-1527.
54. Yu S, Fang H, Han J, et al, 2015 The high prevalence of hypovitaminosis D in China: a multicenter vitamin D status survey. Medicine (Baltimore) 94: e585.
55. Spiro A, Buttriss JL, 2014 Vitamin D: An overview of vitamin D status and intake in Europe. Nutr Bull 39: 322-350.
56. Chin KY, Ima-Nirwana S, Wan Ngah WZ, 2015 Vitamin D is significantly associated with total testosterone and sex hormone-binding globulin in Malaysian men. Aging Male: 1-5.
57. Heijboer AC, Oosterwerff M, Schroten NF, et al, 2015 Vitamin D supplementation and testosterone concentrations in male human subjects. Clin Endocrinol (Oxf) 83: 105-110.
58. Garevik N, Rane A, Bjorkhem-Bergman L, Ekstrom L, 2014 Effects of different doses of testosterone on gonadotropins, 25-hydroxyvitamin D3, and blood lipids in healthy men. Subst Abuse Rehabil 5: 121-127.
59. van der Wielen R, Löwik M, van den Berg H, et al, 1995 Serum vitamin D concentrations among elderly people in Europe. Lancet 346: 207-210.
60. Carnevale V, Modoni S, Pileri M, et al, 2001 Longitudinal evaluation of vitamin D status in healthy subjects from southern Italy: seasonal and gender differences. Osteoporosis Int 12: 1026-1030.
61. Adami S, Viapiana O, Gatti D, Idolazzi L, Rossini M 2008 Relationship between serum parathyroid hormone, vitamin D sufficiency, age, and calcium intake. Bone 42: 267-270.
62. Lips P, 2010 Worldwide status of vitamin D nutrition. J Steroid Biochem Mol Biol 121: 297-300.
63. Gómez JM, Maravall FJ, Gómez N, Navarro MA, Casamitjana R, Soler J, 2004 Relationship between 25-(OH) D3, the IGF-I system, leptin, anthropometric and body composition variables in a healthy, randomly selected population. Horm Metab Res 36: 48-53.
64. Lapatsanis D, Moulas A, Cholevas V, Soukakos P, Papadopoulou ZL, Challa A, 2005 Vitamin D: a necessity for children and adolescents in Greece. Calcif Tissue Int 77: 348-55.
65. Muray S, Marco MP, Craver L, Rue M, Valdivielso JM, Fernandez E, 2006 Influence of mineral metabolism parameters on pulse pressure in healthy subjects. Clin Nephrol 66: 411-417.
66. Bouillon R, Eelen G, Verlinden L, Mathieu C, Carmeliet G, Verstuyf A, 2006 Vitamin D and cancer. J Steroid Biochem Mol Biol 102: 156-162.
67. Touvier M, Deschasaux M, Montourcy M, et al, 2015 Determinants of vitamin D status in Caucasian adults: influence of sun exposure, dietary intake, sociodemographic, lifestyle, anthropometric, and genetic factors. J Invest Dermatol 135: 378-388.
68. Skeie G, Braaten T, Hjartaker A, et al, 2009 Use of dietary supplements in the European Prospective Investigation into Cancer and Nutrition calibration study. European journal of clinical nutrition 63 Suppl 4: 2262-38.
69. Lips P, 2001 Vitamin D deficiency and secondary hyperparathyroidism in the elderly: consequences for bone loss and fractures and therapeutic implications. Endocr Rev 22: 477-501.
70. Aloia JF, Talwar SA, Pollack S, Feuerman M, Yeh JK, 2006 Optimal vitamin D status and serum parathyroid hormone concentrations in African American women. Am J Clin Nutr 84: 602-609.
71. Malabanan A, Veronikis IE, Holick MF, 1998 Redefining vitamin D insufficiency. Lancet 351: 805-806.
72. Jesudason D, Need AG, Horowitz M, O’Loughlin PD, Morris HA, Nordin BE, 2002 Relationship between Serum 25-Hydroxyvitamin D and Bone Resorption Markers in Vitamin D Insufficiency. Bone 31: 626-630.
73. Need AG, 2006 Bone resorption markers in vitamin D insufficiency. Clin Chim Acta 368: 48-52.
74. von Hurst PR, Stonehouse W, Kruger MC, Coad J, 2010 Vitamin D supplementation suppresses age-induced bone turnover in older women who are vitamin D deficient. J Steroid Biochem Mol Biol 121: 293-296.
75. Sahota O, Masud T, San P, Hosking DJ, 1999 Vitamin D insufficiency increases bone turnover markers and enhances bone loss at the hip in patients with established vertebral osteoporosis. Clin Endocrinol (Oxf) 51: 217-221.
76. Madar AA, Knutsen KV, Stene LC, et al, 2015 Effect of vitamin D3-supplementation on bone markers (serum P1NP and CTX): A randomized, double blinded, placebo controlled trial among healthy immigrants living in Norway. Bone Reports 2: 82-88.
77. Aloia J, Bojadzievski T, Yusupov E, et al, 2010 The relative influence of calcium intake and vitamin D status on serum parathyroid hormone and bone turnover biomarkers in a double-blind, placebo-controlled parallel group, longitudinal factorial design. J Clin Endocrinol Metab 95: 3216-3224.
78. Martins D, Wolf M, Pan D, et al, 2007 Prevalence of cardiovascular risk factors and the serum levels of 25-hydroxyvitamin d in the United States- data from the third national health and nutrition examination survey. Arch Intern Med 167: 1159-1165.
79. Karhapaa P, Pihlajamaki J, Porsti I, et al, 2010 Diverse associations of 25-hydroxyvitamin D and 1,25-dihydroxy-vitamin D with dyslipidaemias. J Intern Med 268: 604-610.
80. Jorde R, Figenschau Y, Hutchinson M, Emaus N, Grimnes G, 2010 High serum 25-hydroxyvitamin D concentrations are associated with a favorable serum lipid profile. European journal of clinical nutrition 64: 1457-1464.
81. Kumar J, Muntner P, Kaskel FJ, Hailpern SM, Melamed ML, 2009 Prevalence and associations of 25-hydroxyvitamin D deficiency in US children: NHANES 2001-2004. Pediatrics 124: e362-370.
82. Jorde R, Grimnes G, 2011 Vitamin D and metabolic health with special reference to the effect of vitamin D on serum lipids. Prog Lipid Res 50: 303-312.
83. Delvin EE, Lambert M, Levy E, et al, 2010 Vitamin D status is modestly associated with glycemia and indicators of lipid metabolism in French-Canadian children and adolescents. J Nutr 140: 987-991.
84. Williams DM, Fraser A, Lawlor DA, 2011 Associations of vitamin D, parathyroid hormone and calcium with cardiovascular risk factors in US adolescents. Heart 97: 315-320.
85. Liu E, Meigs JB, Pittas AG, et al, 2009 Plasma 25-hydroxyvitamin d is associated with markers of the insulin resistant phenotype in nondiabetic adults. J Nutr 139: 329-334.
86. Skaaby T, Husemoen LL, Martinussen T, et al, 2013 Vitamin D status, filaggrin genotype, and cardiovascular risk factors: a Mendelian randomization approach. PLoS One 8: e57647.
87. Ponda MP, Dowd K, Finkielstein D, Holt PR, Breslow JL, 2012 The short-term effects of vitamin D repletion on cholesterol: a randomized, placebo-controlled trial. Arterioscler Thromb Vasc Biol 32: 2510-2515.
88. Rajpathak SN, Xue X, Wassertheil-Smoller S, et al, 2010 Effect of 5 y of calcium plus vitamin D supplementation on change in circulating lipids: results from the Women’s Health Initiative. Am J Clin Nutr 91: 894-899.
89. Miller NE, Thelle DS, Forde OH, Mjos OD, 1977 The Tromsø heart-study. High-density lipoprotein and coronary heart-disease: a prospective case-control study. Lancet 1: 965-968.
90. Fernandez ML, Webb D, 2008 The LDL to HDL cholesterol ratio as a valuable tool to evaluate coronary heart disease risk. J Am Coll Nutr 27: 1-5.
91. Kayaniyil S, Harris SB, Retnakaran R, et al, 2014 Prospective association of 25(OH)D with metabolic syndrome. Clin Endocrinol (Oxf) 80: 502-507.
92. Devaraj S, Jialal G, Cook T, Siegel D, Jialal I, 2011 Low vitamin D levels in Northern American adults with the metabolic syndrome. Horm Metab Res 43: 72-74.
93. Kositsawat J, Freeman VL, Gerber BS, Geraci S, 2010 Association of A1C levels with vitamin D status in U.S. adults: data from the National Health and Nutrition Examination Survey. Diabetes Care 33: 1236-1238.
94. Lindqvist PG, 2014 Cardiology Patient Page. On the possible link between vitamin D deficiency and cardiovascular disease: should we D-lighten our lives? Circulation 129: e413-414.
95. Mitri J, Muraru MD, Pittas AG, 2011 Vitamin D and type 2 diabetes: a systematic review. European journal of clinical nutrition 65: 1005-1015.
96. Christakos S, Hewison M, Gardner DG, et al, 2013 Vitamin D: beyond bone. Ann N Y Acad Sci 1287: 45-58.
97. Rosen CJ, Adams JS, Bikle DD, et al, 2012 The nonskeletal effects of vitamin D: an Endocrine Society scientific statement. Endocr Rev 33: 456-492.
98. Pittas AG, Dawson-Hughes B, 2010 Vitamin D and diabetes. J Steroid Biochem Mol Biol 121: 425-429.
99. Ford ES, Ajani UA, McGuire LC, Liu S 2005 Concentrations of serum vitamin d and the metabolic syndrome among U.S. adults. Diabetes Care 28: 1228-1230.
100. Zittermann A, Schleithoff SS, Koerfer R, 2007 Putting cardiovascular disease and vitamin D insufficiency into perspective. British Journal of Nutrition 94: 483.
101. Dobnig H, Pilz S, Scharnagl H, et al, 2008 Independent association of low serum 25-hydroxyvitamin d and 1,25-dihydroxyvitamin d levels with all-cause and cardiovascular mortality. Arch Intern Med 168: 1340-1349.
102. Wang L, Song Y, Manson JE, et al, 2012 Circulating levels of 25hydroxy-vitamin d and risk of cardiovascular disease: a meta-analysis of prospective studies. Circ Cardiovasc Qual Outcomes 5: 819-829.
103. Vimaleswaran KS, Cavadino A, Berry DJ, et al, 2014 Association of vitamin D status with arterial blood pressure and hypertension risk: a mendelian randomisation study. Lancet Diabetes Endocrinol 2: 719-729.
104. Muscogiuri G, Tirabassi G, Bizzaro G, et al, 2015 Vitamin D and thyroid disease: to D or not to D? European journal of clinical nutrition 69: 291-296.
105. González EA, Sachdeva A, Oliver DA, Martin KJ, 2004 Vitamin D insufficiency and deficiency in chronic kidney disease. A single center observational study. Am J Nephrol 24: 503-510.
106. LaClair RE, Hellman RN, Karp SL, et al, 2005 Prevalence of calcidiol deficiency in CKD: a cross-sectional study across latitudes in the United States. . Am J Kidney Dis 45: 1026-1033.
107. Al-Badr W, Martin KJ, 2008 Vitamin D and kidney disease. Clin J Am Soc Nephrol 3: 155515-60.
108. Williams S, Malatesta K, Norris K, 2009 Vitamin D and Chronic Kidney Disease. Ethn Dis 19: Suppl: 5-11.
109. Melamed ML, Thadhani RI, 2012 Vitamin D therapy in chronic kidney disease and end stage renal disease. Clin J Am Soc Nephrol 7: 358-365.
110. Waldron JL, Ashby HL, Cornes MP, et al, 2013 Vitamin D: a negative acute phase reactant. J Clin Pathol 66: 620-622.
111. Silva MC, Furlanetto TW, 2015 Does serum 25-hydroxyvitamin D decrease during acute-phase response? A systematic review. Nutr Res 35: 91-96.
112. Møller KI, Kongshoj B, Philipsen PA, Thomsen VO, Wulf HC, 2005 How Finsen’s light cured lupus vulgaris. Photodermatol Photoimmunol Photomed 21: 118-124.
113. Zasloff M, 2005 Sunlight, vitamin D, and the innate immune defenses of the human skin. J Invest Dermatol 125: 16-17.
114. Liu PT, Stenger S, Li H, et al, 2006 Toll-like receptor triggering of a vitamin D-mediated human antimicrobial response. . Science 311: 1770-1773.
115. Wang TT, Nestel FP, Bourdeau V, et al, 2004 1,25-dihydroxyvitamin D3 is a direct inducer of antimicrobial peptide gene expression. J Immunol 173: 2909-2912.
116. Chun RF, Liu PT, Modlin RL, Adams JS, Hewison M, 2014 Impact of vitamin D on immune function: lessons learned from genome-wide analysis. Front Physiol 5: 151.
117. Jeffery LE, Wood AM, Qureshi OS, et al, 2012 Availability of 25-hydroxyvitamin D(3) to APCs controls the balance between regulatory and inflammatory T cell responses. J Immunol 189: 5155-5164.
118. Bang UC, Novovic S, Andersen AM, Fenger M, Hansen MB, Jensen JE, 2011 Variations in serum 25-hydroxyvitamin D during acute pancreatitis: an exploratory longitudinal study. Endocr Res 36: 135-141.
119. Reid D, Toole BJ, Knox S, et al, 2011 The relation between acute changes in the systemic inflammatory response and plasma 25-hydroxyvitamin D concentrations after elective knee arthroplasty. Am J Clin Nutr 93: 1006-1011.
120. Ferder M, Inserra F, Manucha W, Ferder L, 2013 The world pandemic of vitamin D deficiency could possibly be explained by cellular inflammatory response activity induced by the renin-angiotensin system. Am J Physiol Cell Physiol 304: C1027-1039.
121. Mangin M, Sinha R, Fincher K, 2014 Inflammation and vitamin D: the infection connection. Inflamm Res 63: 803-819.
122. Metheniti D, Sakka S, Dracopoulou M, et al, 2013 Decreased circulating 25-(OH) Vitamin D concentrations in obese female children and adolescents: positive associations with Retinol Binding Protein-4 and Neutrophil Gelatinase-associated Lipocalin. Hormones (Athens) 12: 397-404.
123. Krishnan AV, Feldman D, 2011 Mechanisms of the anti-cancer and anti-inflammatory actions of vitamin D. Annu Rev Pharmacol Toxicol 51: 311-336.
124. Earthman CP, Beckman LM, Masodkar K, Sibley SD, 2012 The link between obesity and low circulating 25-hydroxyvitamin D concentrations: considerations and implications. Int J Obes (Lond) 36: 387-396.
125. Speedy AW, 2003 Global production and consumption of animal source foods. J Nutrition 133: Suppl 2: 4048-4053.
126. Singh GM, Micha R, Khatibzadeh S, et al, 2015 Global, regional, and national consumption of sugar-sweetened beverages, fruit juices, and milk: a systematic assessment of beverage intake in 187 countries. PLoS One 10: e0124845.
127. Arunabh S, Pollack S, Yeh J, Aloia JF, 2003 Body fat content and 25-hydroxyvitamin D levels in healthy women. J Clin Endocrinol Metab 88: 157-161.
128. Sneve M, Figenschau Y, Jorde R, 2008 Supplementation with cholecalciferol does not result in weight reduction in overweight and obese subjects. Eur J Endocrinol 159: 675-684.
129. Zittermann A, Frisch S, Berthold HK, et al, 2009 Vitamin D supplementation enhances the beneficial effects of weight loss on cardiovascular disease risk markers. Am J Clin Nutr 89: 1321-1327.
130. Vimaleswaran KS, Berry DJ, Lu C, et al, 2013 Causal relationship between obesity and vitamin D status: bi-directional Mendelian randomization analysis of multiple cohorts. PLoS Med 10: e1001383.
131. Bertrand KA, Giovannucci E, Liu Y, et al, 2012 Determinants of plasma 25-hydroxyvitamin D and development of prediction models in three US cohorts. Br J Nutr 108: 1889-1896.
132. Bolland MJ, Chiu WW, Davidson JS, et al, 2008 The effects of seasonal variation of 25-hydroxyvitamin D on diagnosis of vitamin D insufficiency. N Z Med J 121: 63-74.
133. Brock K, Huang WY, Fraser DR, et al, 2010 Low vitamin D status is associated with physical inactivity, obesity and low vitamin D intake in a large US sample of healthy middle-aged men and women. J Steroid Biochem Mol Biol 121: 462-466.
134. Hermann AP, Brot C, Gram J, Kolthoff N, Mosekilde L, 2000 Premenopausal smoking and bone density in 2015 perimenopausal women. J Bone Miner Res 15: 780-787.
135. Supervía A, Nogués X, Enjuanes A, et al, 2006 Effect of smoking and smoking cessation on bone mass, bone remodeling, vitamin D, PTH and sex hormones. J Musculoskelet Neuronal Interact 6: 234-241.
136. Kimlin M, Harrison S, Nowak M, Moore M, Brodie A, Lang C, 2007 Does a high UV environment ensure adequate vitamin D status? J Photochem Photobiol B 89: 139-147.
137. Freedman DM, Cahoon EK, Rajaraman P, et al, 2013 Sunlight and other determinants of circulating 25-hydroxyvitamin D levels in black and white participants in a nationwide U.S. study. Am J Epidemiol 177: 180-192.
138. Jorde R, Saleh F, Figenschau Y, Kamycheva E, Haug E, Sundsfjord J, 2005 Serum parathyroid hormone (PTH) levels in smokers and non-smokers. The fifth Tromsø study. Eur J Endocrinol 152: 39-45.
139. Need AG, Kemp A, Giles N, Morris HA, Horowitz M, Nordin BE, 2002 Relationships between intestinal calcium absorption, serum vitamin D metabolites and smoking in postmenopausal women. Osteoporosis Int 13: 83-88.
140. Bjørneboe GE, Johnsen J, Bjørneboe A, et al, 1986 Effect of alcohol consumption on serum concentration of 25-hydroxyvitamin D3, retinol, and retinol-binding protein. Am J Clin Nutr 44: 678-682.
141. Saquib N, von Mühlen D, Garland CF, Barrett-Connor E, 2006 Serum 25-hydroxyvitamin D, parathyroid hormone, and bone mineral density in men: the Rancho Bernardo study. Osteoporosis Int 17: 1734-1741.
142. McCullough ML, Weinstein SJ, Freedman DM, et al, 2010 Correlates of circulating 25-hydroxyvitamin D: Cohort Consortium Vitamin D Pooling Project of Rarer Cancers. Am J Epidemiol 172: 21-35.
143. Wang TJ, Zhang F, Richards JB, et al, 2010 Common genetic determinants of vitamin D insufficiency- a genome-wide association study. Lancet 376: 180-188.
144. Ahn J, Yu K, Stolzenberg-Solomon R, et al, 2010 Genome-wide association study of circulating vitamin D levels. Hum Mol Genet 19: 2739-2745.
145. Norman A 2008 From vitamin D to hormone D. Am J Clin Nutr 88: Suppl: 491-499.
Address for correspondence:
Niki Malliaraki, MD, PhD, Laboratory of Clinical Chemistry-Biochemistry, University Hospital of Heraklion, P.O. Box 1352, Heraklion, 71110, Greece; Tel: +302810392590, E-mail: nmalliaraki@pagni.gr
Received: 18-06-2015, Accepted: 23-03-2016